
90 Day Playbook to Achieve Real Time Project Visibility for Managers

Real-time project visibility means every stakeholder can see current status, blockers, and risk the moment they happen, not days later in a status meeting. The single first move that matters most: pick one live plan or dashboard, make it mandatory, and retire the spreadsheets competing with it. Do that, and you catch delays while they’re still fixable instead of reading about them in a postmortem.
TL;DR:
- Building a single live project plan or dashboard and retiring spreadsheets significantly improves real-time visibility and helps identify delays early.
- Mobile data entry with offline support, role-based dashboards, and integration with scheduling and accounting software are essential features for effective visibility.
- Successful adoption depends on demonstrating immediate value through recognition, replacing old workflows, and involving dedicated champions rather than extensive training.
- A phased implementation over 90 days focusing on baseline, pilot, and expansion, with weekly participation and reliability metrics, drives sustainable change.
- Seeing quick wins like early issue detection and participation growth in the first two weeks encourages continued use and widespread adoption of the system.
Table of Contents
- Why Real-Time Project Visibility Matters for Your Bottom Line
- Core Techniques to Build Real-Time Visibility
- What Features and Integrations Should You Actually Require?
- How Do You Get Crews to Actually Adopt the System?
- The 90-Day Implementation Checklist
- What I’ve Learned Watching Rollouts Succeed and Fail
- How DesignFlow Build Gets You There Faster
- Sources
Why Real-Time Project Visibility Matters for Your Bottom Line
Most contractors don’t lack data. They lack a single place where that data means something the moment it’s entered. Real-time monitoring closes that gap by continuously tracking progress, blockers, dependencies, and workload instead of waiting for a weekly report to surface a problem that started on Tuesday.
The business case is straightforward. Fewer schedule slips. Less rework because someone caught a conflict before it got poured in concrete. Better margin protection because you’re not discovering a labor overrun three weeks after it happened.
On the operational side, you get faster RFI turnaround, clearer ownership on every open item, and better resource allocation because superintendents aren’t guessing where crews are needed most.
You’ll know it’s working when you see:
- Consistent, high participation from field crews entering updates without being chased
- Rising Percent Plan Complete (PPC), the industry’s standard measure of plan reliability
- A shrinking number of side systems, texts, and personal spreadsheets people quietly use instead of the official tool
That last signal is often ignored, but it’s the loudest one. Wipfli’s survey of construction executives found 59% report full or extensive software integration, yet only about 30% actually meet the bar for high technology maturity. More tools doesn’t mean more visibility. Integration and disciplined use do.
Core Techniques to Build Real-Time Visibility
Visibility isn’t a feature you buy. It’s a set of habits you build around one live source of truth. Here’s how to do it in a sequence that actually sticks.
- Migrate an existing ritual, don’t invent a new one. If your teams already run a three-week look-ahead, move it entirely into a live plan and use that plan in every coordination meeting. Nothing kills adoption faster than asking people to maintain two versions of the same schedule.
- Build dashboards around exceptions, not raw data. A dashboard with forty columns of numbers gets ignored. A dashboard that flags the six tasks behind schedule and the three cost codes trending over budget gets checked every morning.
- Push task-level updates from the field, live. Blockers and dependency conflicts need to surface the day they occur, not at Friday’s status call. Voice-to-text field entry removes the excuse that updating status takes too long.
- Set lightweight KPIs and stick to three. Participation rate, PPC, and side-system count. That’s enough to know if the system is healthy without drowning leadership in metrics nobody reads.
- Automate alerts for the deviations that actually matter. A missed inspection window or a cost code trending 15% over budget should trigger a notification automatically, not wait for someone to notice it during a review.
Pro Tip: Don’t launch a new dashboard alongside the old reporting process “just in case.” Running both guarantees people default to whichever one is more familiar, and it’s never the new one.
Executives at high-maturity firms don’t treat these as separate initiatives. They’re one workflow with different views for the field, the PM, and the owner. That’s the distinction between a tool that gets checked and one that gets ignored by week three.
What Features and Integrations Should You Actually Require?
Skip the feature checklist that reads like a sales brochure. Here’s what genuinely moves the needle on visibility, regardless of which platform you’re evaluating.
- Field-first mobile capture with offline support. Crews in a basement pour with no signal still need to log status; data should sync automatically once connectivity returns, and it should take fewer than three taps.
- Native integrations with scheduling, cost accounting, and estimating or BIM. A platform that can’t talk to your scheduling software or your job costing forces someone to re-enter the same data twice, which is exactly the manual work you’re trying to eliminate.
- Role-based live dashboards. A superintendent needs a different view than a controller. Exception alerts should route to whoever actually owns the fix.
- Data hygiene built into the structure. Standard naming conventions, required fields, and one single source of truth prevent the fragmentation that undermines visibility even in well-intentioned rollouts. Deloitte’s analysis of construction digital adoption points to fragmented data and weak interoperability as the persistent barrier, even at firms that have invested heavily in software.
- Fast implementation with measurable adoption reporting. If a platform takes six months to configure, you’ve lost the momentum that made the rollout worth doing in the first place.
Mobile capture deserves particular attention because it’s where most rollouts quietly fail. Review how mobile tools actually get used on-site before you commit to a platform, because the gap between a polished demo and a foreman using it in the rain with gloves on is bigger than most vendors admit.
How Do You Get Crews to Actually Adopt the System?
This is where most rollouts die, and it’s rarely a technology problem. ENR’s guidance on digital transformation is blunt on this point: field supervisors need to see direct personal value fast, or the tool gets read as surveillance and quietly abandoned.
Treat adoption like a cultural ritual, not a software rollout. Surface and celebrate the specific moments when live data caught a problem before it became expensive. A foreman who flagged a rebar conflict through the app three days before the pour, and got recognized for it in the Monday meeting, does more for adoption than any training deck.
Practical tactics that actually work:
- Name champions on each crew, publicly, and let them train peers instead of an outside consultant.
- Replace an existing must-do workflow, like the three-week look-ahead, rather than adding a new task on top of the old one.
- Track participation and plan reliability weekly. These two numbers flag slippage before it becomes systemic.
- Run a live pilot on one job before rolling out company-wide, with a single named owner and weekly feedback check-ins.
- Design onboarding to take five minutes, because turnover means you’re training new hires constantly, not once.
Practitioner rollout guidance consistently points to the same lever: make the tool the one place a crew must go to do work they were already required to do, and adoption follows without a mandate memo.
The 90-Day Implementation Checklist
You don’t need a year-long transformation program. You need three focused phases with clear owners and numbers you can check every Friday.
- Days 0 to 14: Foundation. Assign an owner for the rollout, pick the single existing workflow you’re migrating (the look-ahead is the strongest candidate), and baseline your current participation and PPC before you change anything.
- Days 15 to 45: Live pilot. Run it on one active job. Train two or three champions per crew. Instrument the adoption dashboard so leadership can see participation and reliability trending, not just anecdotes.
- Days 46 to 90: Standardize and expand. Retire the parallel spreadsheets and side systems entirely. Expand to additional projects. Publish a leadership-level dashboard so executives see the same numbers the field does.
| Phase | Days | Primary goal | Metric to watch |
|---|---|---|---|
| Foundation | 0–14 | Assign owner, select workflow, baseline metrics | Current PPC and participation rate |
| Live pilot | 15–45 | Run pilot, train champions, build dashboards | Weekly active use, data consistency |
| Standardize | 46–90 | Retire side systems, scale rollout | Side-system count, leadership dashboard adoption |
Phased frameworks built by practitioners tracking adoption failures tend to target over 70% weekly completion and over 80% data consistency by the end of a comparable 90-day window. Those numbers work as a sanity check even if your own targets differ by trade or crew size.
Quick wins to bank in the first two weeks: publish the live plan in the Monday coordination meeting instead of the old printout, and give one champion public credit the first time the dashboard catches something a spreadsheet would have missed.
What I’ve Learned Watching Rollouts Succeed and Fail
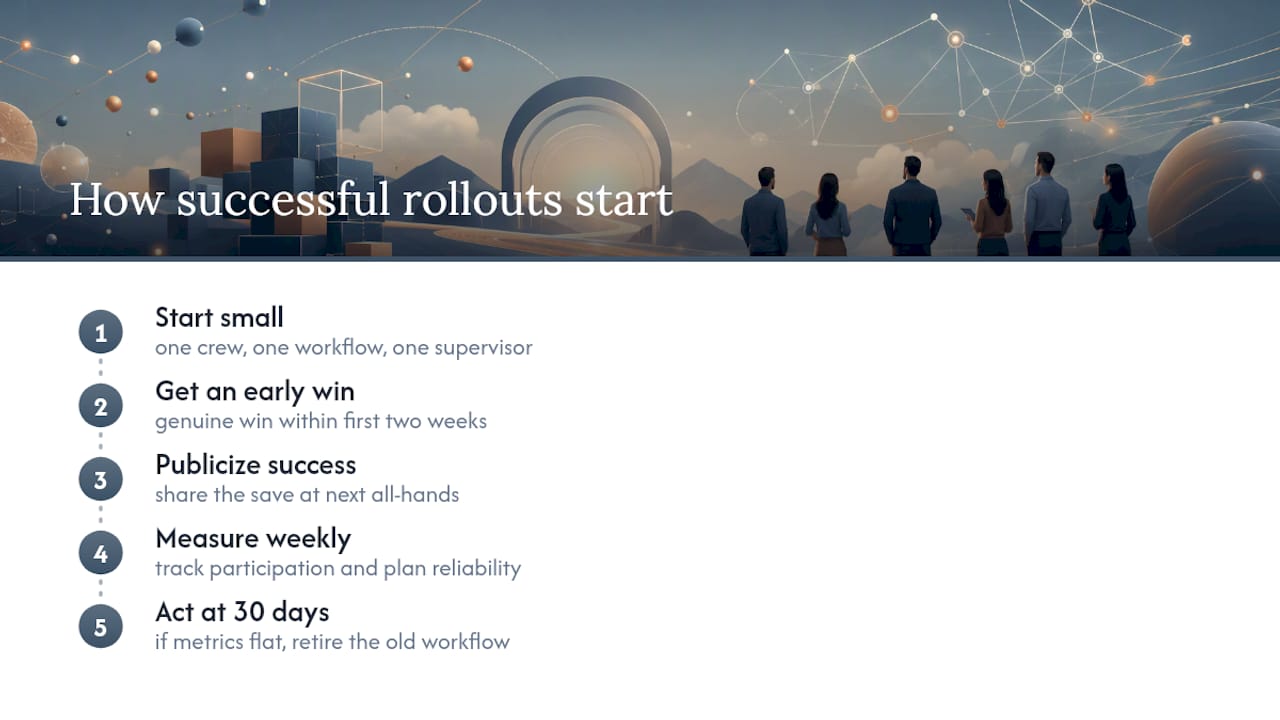
The projects where real-time visibility actually took hold never started with a big-bang rollout. They started with one crew, one workflow, and one supervisor who got a genuine win in the first two weeks. On one job I reviewed, a foreman caught a mechanical conflict through a live update before the drywall went up. That single save, publicized at the next all-hands, did more for adoption than three months of training sessions would have.
Leaders should measure success the same simple way: track participation and plan reliability weekly, not quarterly. If those two numbers are climbing, the rollout is working, regardless of how the software looks in a demo. If they’re flat after thirty days, the problem isn’t the tool. It’s usually that the old workflow never actually got retired.
— Keith
How DesignFlow Build Gets You There Faster
DesignFlow Build is built around the exact checklist this article just walked through: integrated project management, accounting, and field capture in one system, so crews enter data once and it flows everywhere it needs to go. That’s the difference between a platform that sits alongside your spreadsheets and one that actually replaces them.
Contractors using the platform report a significant reduction in manual data entry and substantial monthly savings, largely because AI-driven project management flags resource conflicts and risk before they cause schedule delays. Implementation runs a few weeks rather than half a year, and the platform achieves very high user adoption because the field tools are designed for gloves and job sites, not office desks. If you’re still deciding what terminology maps to what feature, the construction software glossary is a fast way to get oriented. If scheduling integration is your biggest gap right now, take a look at DesignFlow Build’s scheduling software and see how it ties into live dashboards. Request a demo and see how quickly your team could be running one live plan instead of five competing ones.
Sources
- State of technology in the construction industry 2026 | Wipfli
- Core Principles for Getting Construction Companies Over the Digital Hump | Engineering News-Record
- Plane
- State digital adoption — construction industry | Deloitte