
Stop Monthly Surprises: Live Job Cost Dashboard for Construction Teams

A job cost dashboard pulls live labor, material, subcontractor, and change-order data into one screen so you can see cost variance and margin drift the moment they happen, not weeks later in a spreadsheet. The immediate payoff is catching overruns while there’s still time to act: reallocate crews, submit a change order, or renegotiate a sub invoice. Behind it sits your accounting system’s job ledger, timecards, and purchase orders. A tool like Designflow-build can turn that raw data into a live, color-coded view without a manual export.
TL;DR:
- Start with live queries for daily labor swings and nightly ETL for slower-moving cost codes to ensure real-time accuracy.
- Build a dashboard with pages for executive summaries, active jobs, detailed drilldowns, and forecast trends to cover all user needs.
- Link each KPI to a specific data source like timecards, purchase orders, or job ledger, and validate with prototype spreadsheets before automation.
- Implement a clear triage process for overruns, focusing on labor productivity, subcontractor invoices, and scope changes with immediate corrective actions.
- Use an integrated system that automatically updates data from field, accounting, and project management tools to avoid manual reconciliation errors.
Table of Contents
- What a Job Cost Dashboard Shows: Core Components and Views
- Key Metrics and KPIs for Job Cost Tracking
- Where Job Cost Data Comes From and How to Connect It
- How to Build a Starter Job Cost Dashboard Template
- What to Do When the Dashboard Flags an Overrun
- Why Integrated Data Beats a Bolted-On Dashboard
- Get an Integrated Job Cost Dashboard Without the Manual Reconciliation
- Sources
What a Job Cost Dashboard Shows: Core Components and Views
A functional dashboard is built in layers, not one flat screen. Executives need the summary. Field supervisors need the detail. If your current setup only offers one view, it’s missing half its audience.
-
Executive job rollup: contract value, committed cost, cost to date, and estimated at completion (EAC), shown side by side across all active jobs.
-
Job detail drilldowns: cost broken out by labor, materials, subcontractors, equipment, and open change orders, so a PM can trace a variance to its source in seconds.
-
Trend lines: weekly or monthly spend curves that show whether a job is accelerating toward budget or already past it.
-
Heatmaps and variance banding: color coding (green, yellow, red) applied at the cost-code level, not just the job level, so a single overrunning trade doesn’t hide inside a healthy-looking total.
-
Alert flags: automatic markers on jobs crossing a variance threshold, so nobody has to scroll a spreadsheet looking for trouble.
Project managers live in the drilldowns. Executives live in the rollup. Field supervisors mostly need the cost-code heatmap tied to their scope, updated daily rather than at month end.
Key Metrics and KPIs for Job Cost Tracking
Every dashboard needs a defined KPI list with formulas attached. Without them, “over budget” becomes a subjective argument instead of a number anyone can check.
| Metric | Formula | What it tells you |
|---|---|---|
| Cost to date | Sum of posted costs (labor, materials, subs, equipment) | Actual spend so far |
| Cost variance | Budget minus cost to date, adjusted for percent complete | Whether spend is tracking to plan |
| Estimated at completion (EAC) | Cost to date + estimated cost to finish remaining scope | Projected final job cost |
| Percent complete | Cost to date divided by budget, or units installed divided by units planned | Progress relative to spend |
| Job gross margin | (Contract value minus EAC) divided by contract value | Projected profitability |
Add operational metrics alongside the financial ones: labor productivity (units produced per labor hour), equipment utilization, change order ratio (change order value divided by original contract value), and backlog months (future contracted revenue divided by average monthly revenue).
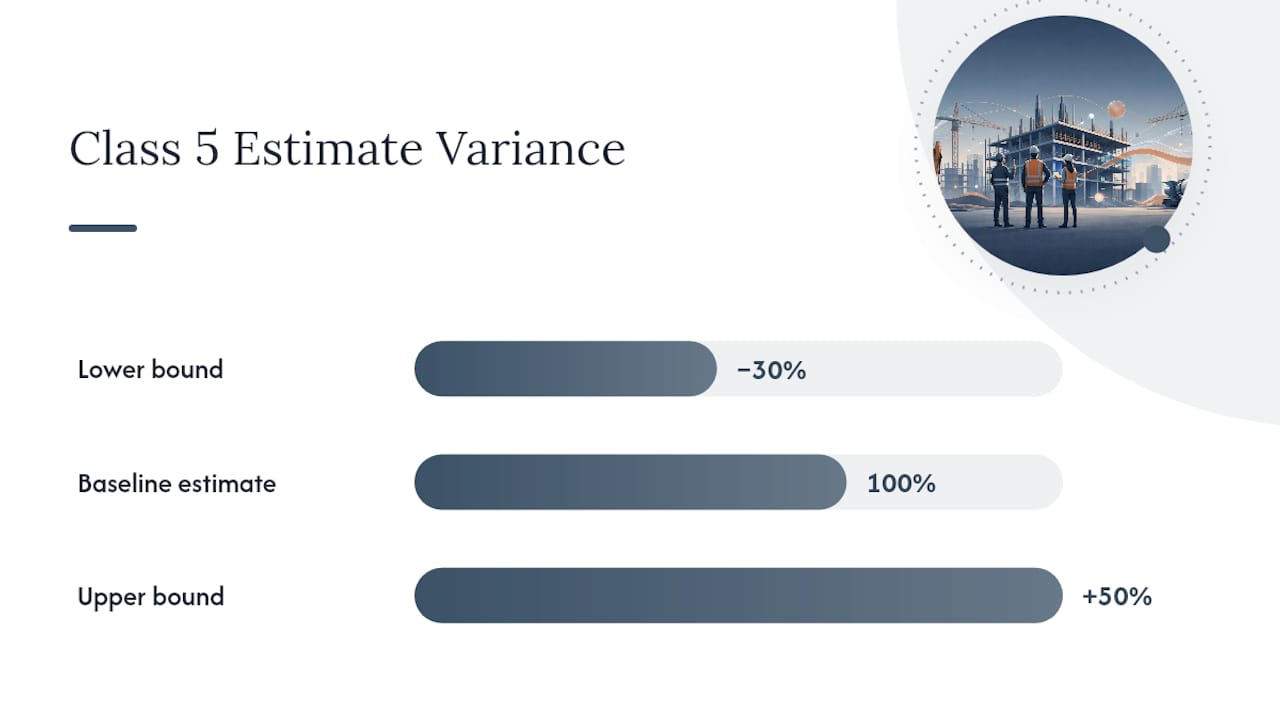
Statistic to know: Class 5 rough order of magnitude estimates can swing -30% to +50%, which is why treating an early-stage number as a firm budget baseline sets your dashboard up to cry wolf.
Where Job Cost Data Comes From and How to Connect It
A dashboard is only as good as its data pipeline. Map each KPI to a specific source before you build a single chart: labor hours and rates come from timecards, committed cost comes from purchase orders and subcontracts, actual spend comes from AP invoices, and contract value plus change orders comes from your ERP job ledger.
Three architectures dominate this space:
- Live system-table queries: pulling directly from your accounting or ERP database tables in near real time, which is the pattern behind system-table queries built for tracking spend trends and identifying the most expensive jobs.
- Nightly ETL into a warehouse: batching data once a day, which trades immediacy for stability and lower system load.
- Spreadsheet imports: manual exports pasted into a BI tool, the slowest option and the most prone to version drift.
Live queries suit fast-moving jobs with daily labor swings. Nightly reconciliation works fine for slower-moving cost codes like fixed subcontracts. Either way, you’ll need read access or an API token scoped correctly, and a workspace configured for your data’s region.
Pro Tip: Don’t wire every KPI to a live feed on day one. Start with cost to date and variance on live queries, and let slower metrics like backlog months run on a nightly sync until your team trusts the numbers.
How to Build a Starter Job Cost Dashboard Template
You don’t need a full ERP rollout to test whether a job cost dashboard changes behavior on your team. Start small and prove the concept before automating the pipeline.
- Build four pages: an executive summary, an active jobs list, a job detail page with drilldown, and a forecast page showing EAC trends.
- Pull three data slices to start: the most expensive jobs over the last 30 days, a spend trend over the last 7 to 14 days, and cost variance broken out by cost code.
- Prototype in a spreadsheet first. A construction KPI dashboard template with preloaded formulas for cost variance and margin at completion is a fast way to validate which numbers your team actually checks before you invest in a live feed.
- Once the spreadsheet proves useful, export the structure as a JSON or CSV schema and import it into your BI tool or ERP dashboard builder.
Your job cost sheet needs at minimum: job number, cost code, budget amount, committed cost, actual cost to date, percent complete, and last-updated timestamp. Skip any of those columns and your dashboard will have blind spots nobody notices until a job is already over.
What to Do When the Dashboard Flags an Overrun
A red flag on a dashboard is worthless without a next step attached to it. Build your triage flow before you need it, not while a job is already bleeding margin.
- Triage by size first: a $5,000 variance on a $2 million job waits until Friday; a $50,000 variance gets a same-day call.
- Check labor productivity first: it’s the most common driver of blown budgets and the fastest to diagnose from timecard data.
- Verify sub invoices: a variance that traces back to a subcontractor billing ahead of progress needs a conversation, not a budget adjustment.
- Reallocate labor or equipment from a job running under budget if the schedule allows it.
- Submit change orders immediately for any scope shift, with photos, RFIs, and daily logs attached, since documentation is what gets a change order approved instead of disputed.
After you act, re-check the EAC seven to ten days later. If the forecast holds instead of drifting further, you’ve confirmed the correction worked. If it doesn’t, the root cause hasn’t been found yet, and it’s time to pull the estimate assumptions and compare them against what’s actually happening in the field.
Pro Tip: Keep a one-line log of every corrective action, its owner, and its expected dollar impact next to the job in your dashboard. It turns “we fixed it” into a number you can defend at the next owner meeting.
Why Integrated Data Beats a Bolted-On Dashboard
Most job cost dashboards fail for a boring reason: the data feeding them lives in three disconnected systems, and someone has to reconcile it by hand before the numbers mean anything. A spreadsheet pulling from QuickBooks on one side and a separate scheduling tool on the other is always a few days behind the field.

Accurate estimating matters just as much as the dashboard itself. Operational dashboards only amplify whatever quality of baseline estimating data you start with. Feed a dashboard from a sloppy budget and it will confidently report the wrong numbers all day long.
This is the case for combining project management, accounting, and field data in one system instead of stitching tools together. Designflow-build’s contractors report a 70% reduction in manual data entry because labor hours, POs, and change orders post to the same ledger the dashboard reads from, with no export step in between.
— Keith
Get an Integrated Job Cost Dashboard Without the Manual Reconciliation
Everything covered above (cost variance, EAC, labor productivity, change order tracking) only works if the underlying data updates itself. Designflow-build combines project management, accounting, and field operations into one system, so your job cost dashboard reads directly from live timecards, purchase orders, and the job ledger instead of a spreadsheet someone has to update by hand.
The AI-native ERP platform also connects estimating and takeoff data directly into job costing, so your baseline budget and your live dashboard are pulling from the same numbers from day one. Start a free trial and get your first job cost dashboard configured this week instead of next quarter.
Sources
- Monitor job costs & performance with system tables
- The ROI of Estimating Accuracy in Preconstruction - Construction Executive
- Construction Estimation: The Complete Guide (2026) - Bluebeam