
Construction Risk Indicators Checklist for ERP-Driven Projects

Start monitoring these nine key risk indicators (KRIs) this week: change order rate, budget variance trend / EAC drift, contingency burn rate, Schedule Performance Index (SPI), critical path float erosion, RFI response time, subcontractor payment days outstanding, labor availability gap, and rework cost %. Your single next action: pick 3–5 of these aligned to your current portfolio’s biggest exposure, assign a named owner to each, and configure threshold alerts in your ERP within seven days.
Here is your first-week checklist:
- Identify one owner per KRI (cost controller, PM, or procurement lead)
- Map each KRI to its primary data source in your ERP (job cost, AP, scheduling integration)
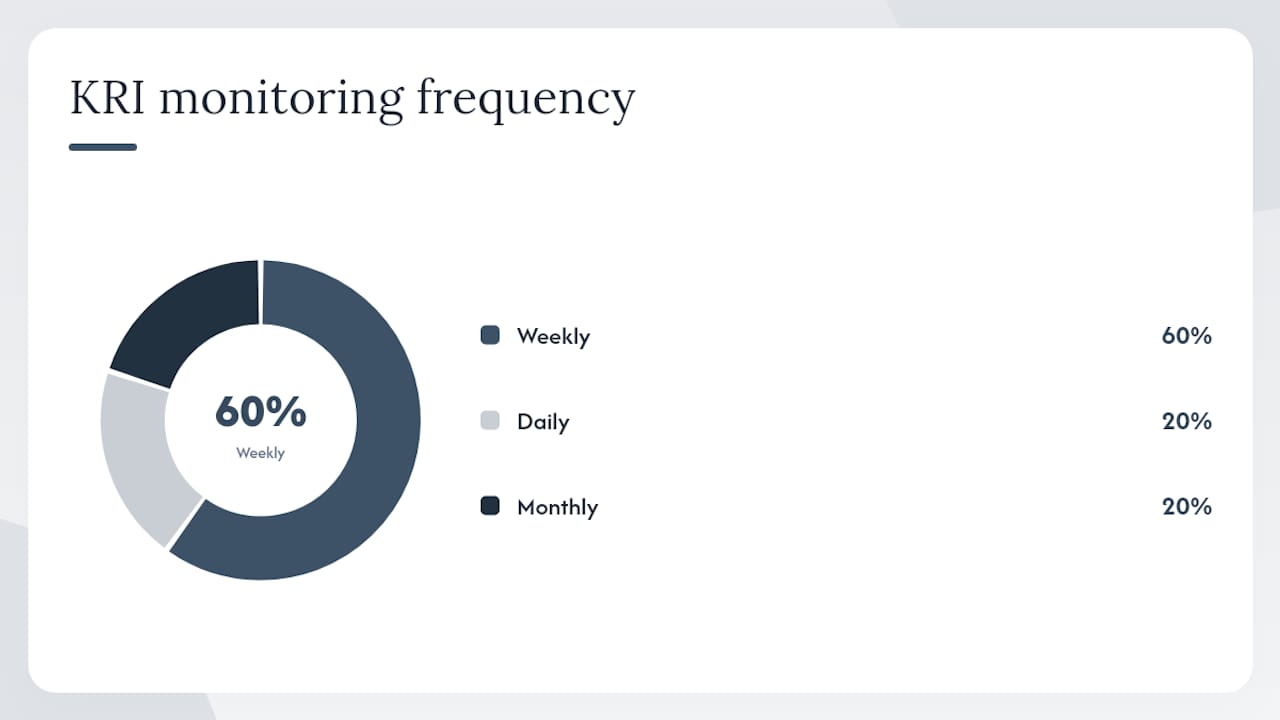
- Set measurement frequency: daily for cash-gap and float erosion, weekly for change order rate and SPI
- Create one dashboard card per KRI with green/amber/red status and a trend arrow
- Document escalation rules: who acts on amber, who escalates red, and the SLA for each
Key Takeaways
Monitoring a set of 3–5 validated leading KRIs in your ERP, tailored to your portfolio’s biggest exposure and assigned to named owners with short escalation SLAs, gives you a meaningful warning advantage over teams relying solely on monthly EVM reports.
| Point | Details |
|---|---|
| Start with 3–5 KRIs this week | Select 3–5 KRIs from nine validated options, matching them to your portfolio’s main risk exposure, and assign one named owner per KRI. |
| Validate data before automating | Run a two-week manual parallel to fix cost-code mapping errors before enabling automated alerts. |
| Calibrate thresholds from your history | Use median and 75th-percentile values from your last 10–20 projects to set green/amber/red bands. |
| Run your first KRI review in 30–90 days | Recalibrate thresholds after 60–90 days of live data and expand coverage across the portfolio. |
| Designflow-build | Configures cost, schedule, and cash-flow KRI alerts in 2–4 weeks with 98% reported adoption. |
Table of Contents
- Why leading KRIs outperform traditional project controls
- Cost KRIs checklist: what to track, who owns it, and how often
- Schedule KRIs checklist: protect the critical path and detect float erosion
- Financial and cash-flow KRIs checklist to protect liquidity
- Resources and procurement KRIs checklist: labor, subs, and materials
- How to pick your 3–5 KRIs, set thresholds, and assign ownership
- Implementing KRIs in your ERP: integrations, alerts, and predictive layers
- KRI dashboard design and weekly/monthly reporting
- 30–90–180 day rollout plan to operationalize KRI monitoring
- Common pitfalls when starting a KRI program and how to fix them
- Methodology and sources behind this checklist
- What actually works in practice for KRI programs
- Designflow-build gets your KRI program live in 2–4 weeks
- Sources
Why leading KRIs outperform traditional project controls
Traditional earned-value management (EVM) measures like CPI and SPI are calculated monthly from actuals already posted. By the time a red flag appears in a monthly report, the cost or schedule damage is done. Leading KRIs surface the conditions that cause overruns before they show up in the numbers.
The Project Health Indicator (PHI) tool from the Construction Industry Institute identifies 43 leading indicators that provide real-time early warning signs of project health and are designed to complement, not replace, traditional EVM and schedule measures. The PHI maps those indicators to five outcomes: cost, schedule, quality/operability, safety, and stakeholder satisfaction.
Research signal: Orgut et al. (ASCE) validated 20 core metrics, 7 validation metrics, and 7 innovative metrics across a study sample and found that projects using more core and diagnostic metrics consistently showed better cost and schedule performance.
The practical implication: a construction risk indicators checklist built on validated leading metrics is thought to provide a 2–4 week head start over teams relying on monthly EVM alone. That window is usually enough to course-correct before a variance becomes a claim.
Key reasons to add leading KRIs to your ERP reporting:
- They flag process breakdowns (slow RFI responses, rising change order frequency) before they move the EAC
- They assign accountability to a named owner, not just a number on a report
- They feed AI-driven predictive layers with the structured, current data those models need to produce reliable forecasts
Cost KRIs checklist: what to track, who owns it, and how often
Real-time budget tracking keeps budgets and actuals synchronized so these KRIs reflect current exposure, not last month’s snapshot.
Pro Tip: Map committed costs separately from incurred costs in your ERP cost codes before enabling KRI alerts. If your change order rate calculation pulls only posted actuals, it will miss approved-but-not-yet-billed commitments and understate exposure by 15–30% on active subcontracts.
Schedule KRIs checklist: protect the critical path and detect float erosion
Designflow-build’s CPM, Monte Carlo, and DCMA scheduling support integrates directly with project cost data, so SPI and float erosion KRIs update from a single source rather than requiring manual exports from a standalone scheduler.
Pro Tip: SPI can mask critical-path risk on projects with many non-critical activities. Track total float on the five longest critical-path chains separately. A project with SPI of 0.92 but zero float on its mechanical completion path is in far worse shape than the index suggests.
Financial and cash-flow KRIs checklist to protect liquidity
An AI forecasting layer ingesting live ERP data can flag 30-day cash gaps before they materialize, but it needs roughly 60–90 days of live data to stabilize approval-cycle and payment-pattern estimates. Plan that learning window into your rollout timeline.
Resources and procurement KRIs checklist: labor, subs, and materials
| KRI | What It Measures | Green | Amber | Red | Data Source | Owner | Frequency |
|---|---|---|---|---|---|---|---|
| Labor availability gap | Actual crew vs. planned crew (% below plan) | <5% | 5–15% | >15% | HR / field app | Operations lead | Daily |
| Subcontractor default / turnover flag | # of subs with payment disputes or mobilization delays | 0 | 1 | >1 | ERP AP + procurement | Procurement lead | Weekly |
| Long-lead item delivery variance | Days late vs. scheduled delivery | 0 days | 1–7 days | >7 days | Procurement / ERP | Procurement lead | Weekly |
| Material price escalation index | Actual unit cost vs. bid-time unit cost (%) | <3% | 3% | >3% | ERP procurement | Cost controller | Monthly |
| Vendor invoice dispute rate | % of invoices disputed or on hold | <2% | 2–5% | >5% | ERP AP | Procurement lead | Weekly |
Pro Tip: Connect supplier portals or EDI feeds directly to your ERP procurement module. Manual data entry for delivery confirmations and invoice status introduces 3–5 day lags that make labor and material KRIs stale before anyone reads them.
How to pick your 3–5 KRIs, set thresholds, and assign ownership
-
Map KRIs to your portfolio’s biggest risk exposure. A cash-heavy GC with thin margins should prioritize DSO, contingency burn rate, and billing-to-earned ratio. A schedule-driven design-build firm should lead with SPI, float erosion, and RFI response time. Match the KRI set to where your projects actually bleed.
-
Calibrate thresholds from historical data. Pull your last 10–20 completed projects from your ERP. Calculate the median and 75th-percentile values for each candidate KRI. Set green at or below the median, amber between median and 75th percentile, and red above it. This grounds thresholds in your own performance history, not generic benchmarks.
-
Assign one named owner per KRI. Shared ownership means no ownership. Each KRI gets one person responsible for the number, one person who acts on amber, and one escalation path for red. Document the SLA: amber triggers a corrective action plan within 48 hours; red triggers an executive review within 24 hours.
PMO ownership checklist:
- KRI name and definition (map to ERP field)
- Named owner and backup
- Measurement frequency and data pull method
- Amber SLA (who acts, by when)
- Red escalation path (who is notified, within what timeframe)
- Threshold review date (recalibrate after 90 days of live data)
A practical KRI framework recommends limiting each domain to 3–5 KRIs to maintain signal quality and avoid alert fatigue during the first 90 days.
Implementing KRIs in your ERP: integrations, alerts, and predictive layers
Required data integrations before enabling automated KRI alerts:
- Scheduling (CPM/Primavera P6 or MS Project): feeds SPI, float erosion, and % critical activities behind
- EVM / job cost: feeds budget variance, EAC drift, contingency burn, and rework cost
- Procurement / AP: feeds subcontractor payment days, committed cost aging, vendor dispute rate
- Document management / RFI system: feeds RFI response time and approval cycle time
- Field productivity / mobile app: feeds labor availability gap and daily production logs
- AR aging: feeds DSO and billing-to-earned ratio
Automation examples that reduce manual effort:
- Change order rate calculates automatically when new COs are approved in the ERP log
- Contingency burn alerts trigger when the burn rate crosses the amber threshold mid-week, not at month-end
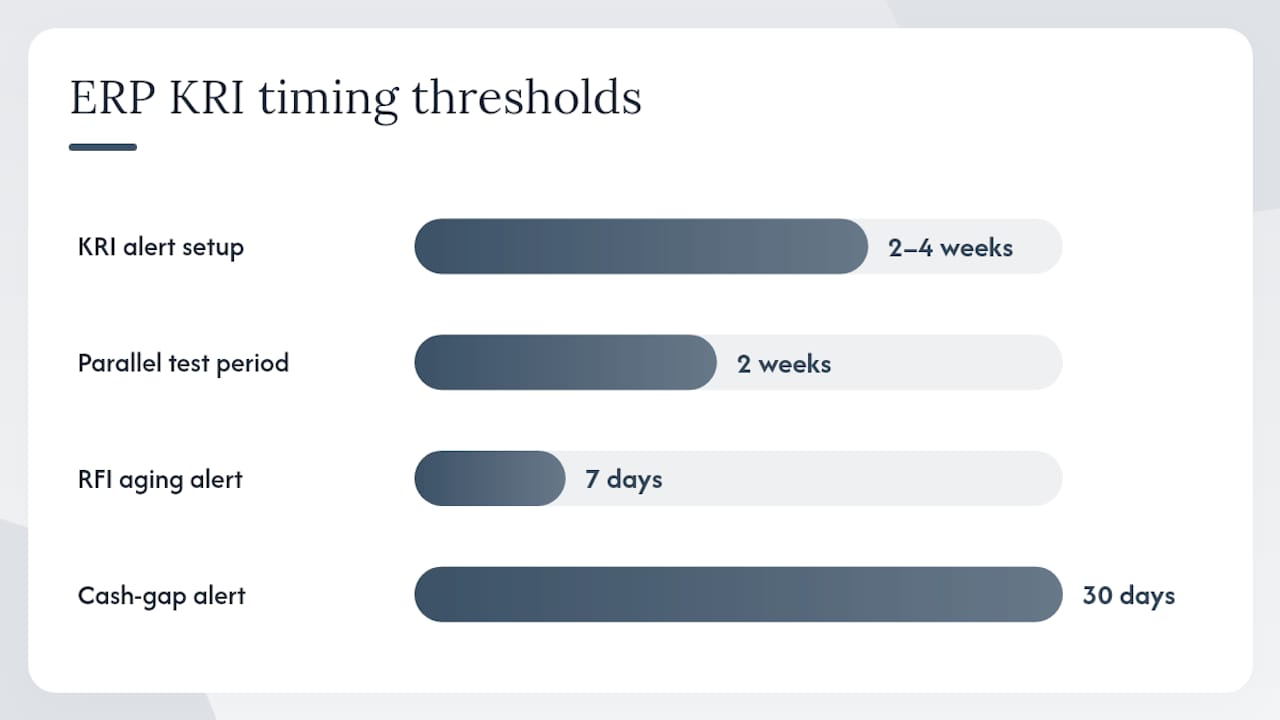
- RFI aging triggers a notification to the PM when an open RFI passes seven days without a response
- Cash-gap notifications push to the controller when the AI forecast model detects a 30-day gap probability above 20%
Designflow-build supports CPM, Monte Carlo, and DCMA scheduling natively, so schedule-driven KRI cards can be configured without a separate scheduling integration project. A typical KRI alert setup runs 2–4 weeks from data mapping to live dashboard.
Pro Tip: Before enabling automated alerts, run a two-week parallel test: calculate each KRI manually and compare to the ERP output. Mismatches almost always trace to committed-vs.-incurred mapping errors or cost-code misclassifications. Fix those first, or your alerts will generate noise from day one.
KRI dashboard design and weekly/monthly reporting
A single-page KRI dashboard should include:
- Project summary header: project name, contract value, % complete, days to substantial completion
- Cost panel: change order rate, contingency burn rate, EAC drift (traffic-light + trend arrow + owner)
- Schedule panel: SPI, float erosion, RFI response time (traffic-light + trend arrow + owner)
- Financial/operations panel: DSO, billing-to-earned ratio, labor availability gap (traffic-light + trend arrow + owner)
- Action items table: KRI name, status, corrective action, owner, due date
Weekly report contents: all amber and red KRIs, one-line corrective action per item, owner, and due date. Keep it to one page. Monthly executive pack adds EAC movement vs. prior month, a portfolio heat map showing red KRIs by project, and a contingency reserve summary.
Reporting signal: ERP-driven executive reporting that normalizes KPIs across projects gives leadership a single version of backlog, committed cost, and risk, which is the foundation for reliable portfolio-level decisions.
30–90–180 day rollout plan to operationalize KRI monitoring
Common pitfalls when starting a KRI program and how to fix them
- Noisy thresholds: generic benchmarks trigger constant amber alerts. Fix: calibrate from your own historical project data (see Section 7).
- Stale inputs: KRIs updated monthly from manual exports are lagging indicators in disguise. Fix: automate data pulls from ERP and scheduling at daily or weekly frequency.
- Too many KRIs: tracking 15 KRIs from day one overwhelms owners and dilutes accountability. Fix: pilot 3–5 KRIs on one representative project before expanding.
- Unclear ownership: a KRI with two owners or no owner gets ignored when it turns red. Fix: one named owner, one escalation path, documented SLA.
- Alert fatigue from AI-driven notifications: AI alerts without human validation create noise that teams learn to ignore. Fix: during the first 90 days, require a human review of every red alert before it triggers an escalation. Automate escalation only after the model’s false-positive rate drops below 10%.
- Governance gaps: KRIs configured but never reviewed in project meetings become shelfware. Fix: add a standing five-minute KRI review to every weekly project meeting agenda.
Methodology and sources behind this checklist
This checklist draws on two validated research foundations:
The PHI tool (Construction Industry Institute) maps 43 leading indicators to five project outcomes: cost, schedule, quality/operability, safety, and stakeholder satisfaction. Each indicator has a guidance sheet for measurement, making it directly configurable in an ERP.
The Orgut et al. ASCE study used a Delphi validation process with subject-matter experts and statistical analysis across a project sample to confirm that 20 core and 7 diagnostic metrics correlate with better cost and schedule outcomes. The KRIs in this checklist map directly to that validated core set.
Validation signal: Projects using more core and diagnostic metrics from the Orgut et al. study consistently showed better cost and schedule performance, providing statistical backing for the KRI selection approach here.
The checklist also aligns with the RiskPublishing KRI framework, which recommends 3–5 KRIs per domain, owner assignment, and short measurement cadence as the minimum viable governance structure. The financial waste checklist from Designflow-build provides complementary quick-win assessment steps for baseline data collection.
What actually works in practice for KRI programs
Most KRI programs fail in the first 90 days for one reason: the data isn’t ready. Teams configure dashboards before they’ve validated that cost codes are consistent, committed costs are mapped correctly, and scheduling data syncs reliably. The result is a beautiful dashboard full of misleading numbers, and once owners lose trust in the data, they stop looking.
Start with data quality, not dashboard design. Run a two-week manual parallel before you automate anything. Fix the mapping errors you find. Then turn on the alerts.
The second failure mode is ownership without accountability. Assigning a KRI to a role title (“the PM”) rather than a named person means the alert sits in a shared inbox. Name the person. Set the SLA in writing. Review it in the weekly meeting. That combination, named owner plus short escalation SLA plus standing agenda item, is what separates a KRI program that drives decisions from one that generates reports nobody reads.
Automation is the goal, but human review during the learning window is what gets you there reliably.
Designflow-build gets your KRI program live in 2–4 weeks
Most ERP implementations take months and require a team of consultants. Designflow-build is built differently: AI-native, with CPM/Monte Carlo scheduling, automated change-order tracking, real-time job costing, and predictive cash-flow scoring all in one platform. You can configure change order rate and contingency burn alerts in the same week you map your cost codes, not six months later.
The 98% adoption rate and 2–4 week implementation timeline mean your team is reviewing live KRI dashboards before the end of your first month, not still in training. The reported 70% reduction in manual data entry means your owners spend time acting on alerts, not building spreadsheets to produce them. View the AI-native ERP platform or explore scheduling and KRI configuration to see how the setup works. Request a demo and have your first three KRI cards configured within the week.
Sources
- Metrics that matter: Evaluation of metrics and indicators for project progress measurement, performance assessment, and performance forecasting during construction — ASCE (Orgut et al.)