
Digital Site Reporting: What It Is and How to Adopt It
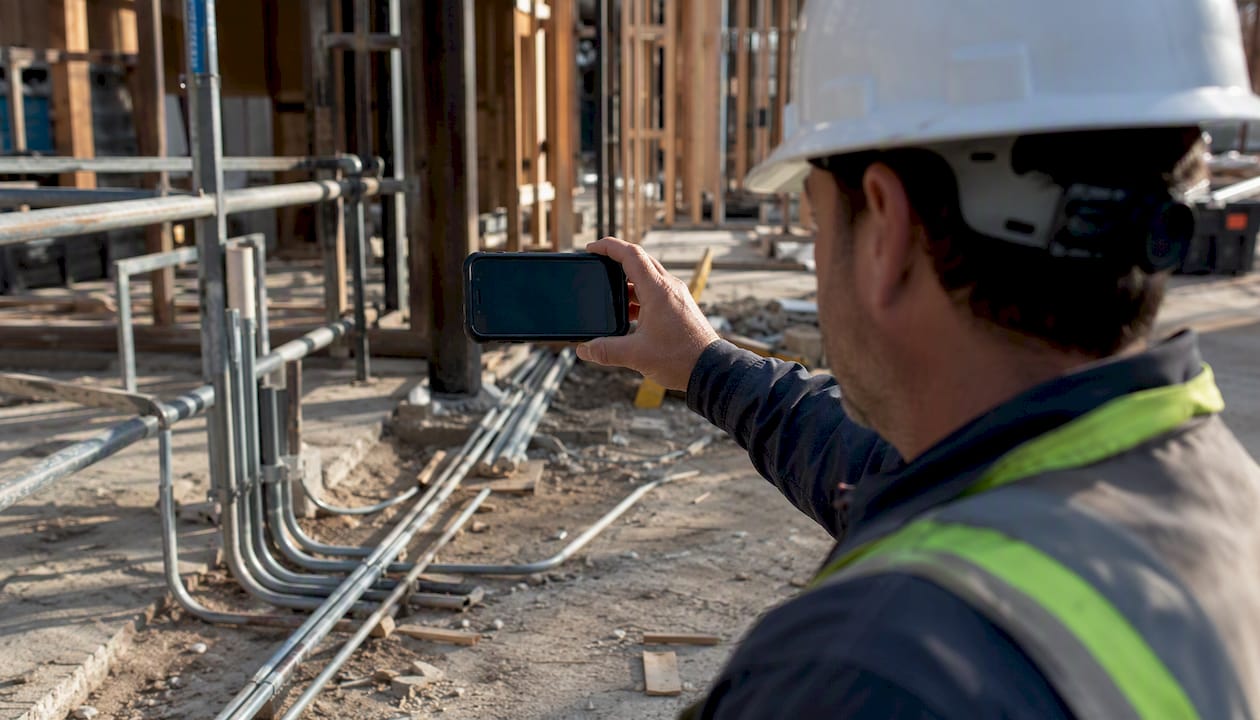
Digital site reporting is the practice of capturing daily construction records, such as photos, crew logs, weather, and safety notes, through mobile apps or software instead of paper forms, creating time-stamped, geo-tagged evidence that speeds approvals and holds up in disputes. It replaces the crumpled site diary with structured data that syncs to the cloud the moment it’s captured. For contractors juggling multiple crews and subcontractors, that shift matters because a paper trail with holes in it is a liability, and a digital one is an asset.
Think of it as a version of what the Financial Reporting Council calls digital reporting applied to a jobsite: structured formats, standard fields, and machine-readable data instead of a stack of handwritten notes nobody can search. A few things anchor this concept in construction specifically:
- Structured over freeform: fields like crew count, weather, and work performed get captured the same way every time, so the data can be searched, compared, and audited later.
- Evidence over memory: photos with geo-tags and timestamps replace “I think that was poured on a Tuesday” with proof.
- A platform like Designflow-build shows how this data, once structured, feeds directly into project management and accounting without a second data-entry pass.
Key Takeaways
Digital site reporting works because structured, timestamped, geo-tagged field data replaces disputable memory with defensible evidence that speeds approvals and cuts rework.
| Point | Details |
|---|---|
| Start with a minimum template | Capture crew, weather, work performed, and photos before adding complexity. |
| Pilot before scaling | Run a 2 to 4 week pilot on one project before rolling out company-wide. |
| Require geo-tagged photos | Make at least one geo-tagged, timestamped photo mandatory per inspection. |
| Track a few core KPIs | Monitor report completion rate, time to close issues, and dispute counts. |
| Connect reporting to your ERP | Designflow-build links field reports directly to job costing and compliance, cutting manual data entry significantly. |
Table of Contents
- What Is Digital Site Reporting in Practice on a Jobsite?
- Key Features and Components Worth Evaluating
- Common Types of Digital Site Reports You’ll Actually Use
- The Practical Benefits for Your Project
- What a Complete Digital Report Should Include
- How to Roll Out Digital Reporting on Your Project
- Choosing the Right Tools for Your Tech Stack
- Metrics That Prove Digital Reporting Is Working
- How Structured Data Enables Automation and Real Savings
- What Deployments Get Wrong (And How to Fix It)
- Where an Integrated ERP Fits Into Your Reporting Strategy
- Sources
What Is Digital Site Reporting in Practice on a Jobsite?
Here’s the typical flow on a project that’s made the switch. A superintendent or foreman opens a mobile app first thing in the morning, logs the crew on site, notes weather conditions, and starts building the daily record as work happens rather than trying to reconstruct it from memory at 6 p.m. Photos get snapped in the moment, an issue gets flagged the second it’s spotted, and by the time the report syncs to the office, the project manager already has visibility into what happened without waiting for a phone call.
That sync-and-distribute step is where the real value shows up. A report submitted from a tablet on-site can trigger a notification to the PM, get routed for approval, and land in a searchable archive within minutes. Compare that to a paper form that sits in a truck cab for three days before anyone reads it.
Most digital reports, regardless of the app, capture a consistent set of elements:
- Date, project name, and shift or crew identifier
- Weather conditions and temperature (relevant for concrete pours, roofing, and other weather-sensitive work)
- Crew on site, by trade and headcount
- Plant and equipment on site
- Work performed, described in plain language
- Issues, delays, or observations
- Photos with captions
- Geo-tags and timestamps attached automatically
- Digital signatures from the person submitting and, where required, the approver
A single entry might read like this in practice:
That’s a complete, defensible record in under 30 seconds of typing, something a handwritten log rarely achieves with the same precision.
Key Features and Components Worth Evaluating
Not every app calling itself a “digital reporting tool” delivers the same value. When you’re comparing options, the feature list matters less than whether the tool nails a handful of core capabilities.
- Customizable templates that match your report types without forcing every project into a generic form
- Photo capture and annotation, including the ability to draw arrows or circles directly on an image to point out a defect
- Automatic timestamps and geo-tags attached to every photo and entry, with no manual entry required
- Offline mode that queues data locally and syncs once connectivity returns, since most jobsites don’t have reliable Wi-Fi
- Digital signatures for accountability at submission and approval
- Version history so edits after submission are tracked, not silently overwritten
- Exportable PDFs for sharing with clients, architects, or insurers who still expect a formatted document
- An audit trail showing who created, edited, and approved each record, and when
Of these, the audit trail and the automatic time and geo metadata are the two that matter most when a claim or dispute lands on your desk. A photo without a timestamp is just a picture. A photo with a timestamp, geo-tag, and an unbroken chain of custody is evidence, and that distinction shows up directly in how digitized construction reporting supports the “golden thread” of compliance records that regulators and insurers increasingly expect.
Pro Tip: If you can only prioritize one feature when picking a tool, pick offline capability. A reporting app that can’t function without signal is useless on half the jobsites you’ll ever run.
Common Types of Digital Site Reports You’ll Actually Use
Construction teams don’t need one universal report. They need several specific ones, each serving a different reader and a different purpose.
- Daily site report: written by the superintendent or foreman, read by the PM and client, covering crew, weather, work performed, and issues. This is the backbone record for the entire project.
- Inspection report: completed by a quality manager or third-party inspector, documenting whether work meets spec before it’s covered up or signed off. Cloud-based inspection reporting now delivers these results near-instantly instead of after a multi-day lag.
- Safety or incident report: filed by whoever witnesses or is involved in an incident, reviewed by safety managers and often regulators, with critical fields for time, location, injured parties, and corrective action.
- QA/QC report: documents quality checks against specifications, typically written by quality control staff and referenced during handover or warranty disputes.
- Snag or punch list: a running log of defects to fix before final acceptance, written by the client’s rep or the PM and tracked until every item is closed.
- Weekly progress report: a rollup for stakeholders who don’t need daily detail but do need to know whether the schedule is holding.
- Meeting minutes: captured digitally and distributed immediately rather than typed up days later from handwritten notes.
- Handover report: the final compilation of records, warranties, and as-built documentation delivered to the owner at project close.
Each of these has a different reader and a different consequence if the record is missing or wrong. A missing daily report is an inconvenience. A missing safety incident report can be a legal problem.
The Practical Benefits for Your Project
The case for switching isn’t abstract. It shows up in how fast decisions get made and how well you’re protected when something goes sideways.
- Faster approvals: reports route to the right person the moment they’re submitted, instead of sitting in an inbox.
- Stronger claims defense: geo-tagged, timestamped photos are far harder to dispute than a verbal account of what happened three weeks ago.
- Better safety tracking: incidents get logged and escalated in real time rather than at the end of a shift.
- Higher-quality records: structured fields reduce the ambiguity that comes from handwriting and shorthand.
- Less admin time: no one is retyping paper forms into a spreadsheet at the end of the week.
Digitizing site reporting reduces clerical errors and centralizes records in a way that directly supports faster, cleaner compliance documentation, which matters more every year as regulatory expectations around record-keeping tighten. Beyond the headline benefits, digital reporting builds a searchable archive you can query months later, simplifies audits because everything is already time-stamped and organized, and produces cleaner handover documentation that reduces friction with the owner at closeout.
What a Complete Digital Report Should Include
A good template doesn’t need to be complicated. It needs to be consistent, and it needs to capture the fields that matter most when someone reviews the record later.
| Field | What to Capture |
|---|---|
| Date and project | Project name, location, and the specific date of the entry |
| Weather | Conditions, temperature, and any weather-related delays |
| Crew on site | Headcount by trade, plus subcontractor names |
| Work performed | Plain-language description of tasks completed |
| Issues and observations | Delays, conflicts, or anything requiring follow-up |
| Photos | Geo-tagged, timestamped, with a short caption per image |
| Signatures | Submitter and, where required, approver |
| Actions assigned | Who owns the follow-up and by when |
For photos specifically, a few habits separate a useful record from a cluttered one:
- Shoot at a resolution that lets you zoom in on a defect without losing detail, but not so large that syncing eats up data on a spotty connection.
- Caption every photo with what it shows and why it matters, not just “photo 1.”
- Confirm geo-tagging is enabled by default so location data isn’t something a foreman has to remember to add.
- Use annotation tools to circle or mark specific issues directly on the image rather than describing them in text alone.
- Adopt a consistent file naming convention (project code, date, sequence number) so photos stay organized even if they’re exported outside the app.
A sample filled entry might read: on a Tuesday in early spring, a foreman logs a five-person framing crew, notes light rain that delayed exterior work by two hours, attaches three geo-tagged photos of completed wall framing on the second floor with captions describing each section, flags a minor dimensional discrepancy against the drawings for the architect’s review, and signs off digitally at 4:15 p.m., with the report auto-routed to the PM for same-day acknowledgment.
How to Roll Out Digital Reporting on Your Project
Adoption fails most often because teams try to digitize everything at once. A phased rollout works better and gives you room to fix mistakes before they’re baked into every project.
- Pick a pilot project. Choose one with a cooperative superintendent and moderate complexity, not your highest-stakes job.
- Define the minimum required fields. Resist the urge to capture everything on day one. Start with crew, weather, work performed, and photos.
- Build your templates. Create one template per report type (daily, inspection, safety) rather than a single form trying to do everything.
- Choose your tool. Match the tool to your actual conditions, especially connectivity and crew tech comfort.
- Run training. Keep it short and hands-on. A 30-minute session on a tablet beats an hour-long slideshow.
- Set governance and approval rules. Decide who approves what, and how corrections get logged rather than silently edited.
- Integrate with office systems. Connect reporting data to your project management and accounting workflows so it doesn’t become an isolated silo.
- Scale across the portfolio. Once the pilot proves out, phase in additional projects rather than flipping the switch company-wide overnight.
A realistic cadence looks like a two-to-four-week pilot, followed by a phased rollout across your active projects over the following quarter. Involve your superintendents early, since they’re the ones filling out reports daily, and expect some resistance from crews who’ve done paper logs for twenty years. That resistance usually fades once they see how much time they get back at the end of a shift.
Pro Tip: Assign one person as the “reporting champion” on your pilot project. Having a single point person to answer questions in week one prevents small frustrations from turning into a team-wide rejection of the new process.
Choosing the Right Tools for Your Tech Stack
Digital reporting tools fall into a handful of categories, and knowing which one solves which problem saves you from buying overlapping software.
- Mobile field-reporting apps: built for daily reports, photos, and crew logs, optimized for speed on a phone or tablet.
- Inspection apps: focused on structured checklists and pass/fail criteria, often used by QA/QC teams and third-party inspectors.
- PM/ERP systems: where reporting data should ultimately land so it connects to scheduling, budgets, and accounting instead of living in isolation.
- BIM integrations: link reports and photos to specific model elements, useful on projects where visual context matters for coordination.
- Photo and evidence management apps: specialized tools for organizing large photo libraries with tagging and search.
- Dashboarding tools: platforms like Looker Studio let you pull reporting data into visual dashboards for stakeholders who want a summary view, not a raw report feed.
If you need something running fast, prioritize a simple mobile app with a short learning curve. If you’re managing multiple projects and need everything connected, an integrated ERP with built-in field reporting saves you from stitching together data manually later. And if AI automation is on your roadmap, whatever you choose needs an open API and clean export formats (CSV, PDF, JSON), because AI tools depend on that same structured data to work reliably.
Offline capability deserves its own mention here. Choosing an offline-capable app with automatic sync isn’t optional on most active jobsites, where cell coverage inside a structure or in a remote location is unreliable at best. Whatever platform you’re evaluating, also think about how it performs day to day, since the same lab-versus-real-world distinction that Google’s PageSpeed Insights draws for web performance applies to a dashboard your PMs check constantly: how it performs in a demo often differs from how it performs on a jobsite laptop with a weak signal.
If your project involves survey data, working with a topographic survey partner whose data integrates cleanly with your reporting platform closes a gap that pure photo evidence can’t cover.
Metrics That Prove Digital Reporting Is Working
Switching tools isn’t the finish line. You need a handful of metrics to know whether the switch actually improved anything, and to make the case to leadership if you’re pushing for wider adoption.
- Report completion rate: what percentage of required reports actually get submitted each day.
- Average time to submit: how long it takes from end of shift to a report landing in the system.
- Time to close issues: how quickly flagged problems move from “identified” to “resolved.”
- Number of claims or disputes: a downward trend here is one of the clearest ROI signals you can show.
- Rework rate: whether better documentation is catching problems earlier, before they turn into redone work.
- Photographic coverage per visit: are inspectors and superintendents actually capturing enough visual evidence, or just checking a box.
Most of this data lives in your report metadata, issue logs, and timesheets, and pulling it into a dashboard rather than a spreadsheet makes the trend visible at a glance. That kind of continuous tracking mirrors how real-user monitoring tools measure ongoing performance for web applications; the principle is the same, catch regressions early rather than discovering them at project close. When you present this to stakeholders, frame it around time saved and disputes avoided rather than raw adoption numbers. Leadership cares less about how many reports got filed and more about whether fewer change orders turned into arguments.
How Structured Data Enables Automation and Real Savings
Once your field data is structured and consistent, it becomes fuel for automation that paper records could never support. Voice transcription can turn a foreman’s spoken update into a formatted daily report. Vision models can generate photo captions automatically. AI systems can flag anomalies in progress data before a human ever reviews it. None of that works reliably on inconsistent, freeform paper notes. It works because structured field data is the prerequisite for AI-driven construction management, not an afterthought bolted onto it.
Designflow-build’s customers report a substantial reduction in manual data entry and significant monthly savings once field reporting data flows directly into project management and accounting instead of getting re-typed by an admin. Those are brand-reported figures, not independent benchmarks, but they illustrate the scale of savings possible when reporting stops living in a silo.
- Voice-to-text cuts report write-up time from a lingering end-of-day chore to a few spoken sentences.
- Automated PDF generation eliminates the manual formatting step that used to eat up admin hours weekly.
- Consistent field data feeds risk-prediction models that flag schedule slippage before it becomes a crisis.
On a mid-size commercial rollout, moving from paper daily logs to structured digital reporting typically means approvals that used to take two or three days close within hours, and photo evidence tied to timestamps resolves payment disputes that once required a site visit to sort out. The pattern shows up consistently: the projects with the cleanest reporting data are also the ones with the fewest end-of-job disputes.
What Deployments Get Wrong (And How to Fix It)
The biggest mistake teams make isn’t picking the wrong app. It’s over-customizing the template before anyone has used it once. A superintendent asks for twelve extra fields in week one, and by week three nobody’s filling out half of them because the form takes fifteen minutes instead of two.
The second most common failure is missing governance. Without clear rules on who approves what and how corrections get logged, digital reports drift back into the same ambiguity paper had, just with better formatting. Poor photo practices compound this: teams skip geo-tagging because it feels optional, then discover during a dispute that the one photo that mattered has no location data attached. And any tool without solid offline support gets abandoned within a month on a job with weak signal, because crews will always default to whatever’s faster in the moment.
- Start with a minimum viable template. Add fields only after the pilot proves the basics work.
- Require at least one geo-tagged photo per inspection, no exceptions.
- Assign a single approver per report type so corrections have a clear owner.
- Test offline mode on your actual jobsite conditions before rolling out company-wide, not just in the office with full Wi-Fi.
One project team learned this the hard way when a foreman’s phone lost signal for three days straight and none of his reports synced until he was back in range, leaving the PM blind to a schedule slip that could have been caught immediately. The fix wasn’t a new app. It was confirming offline queuing actually worked as advertised before trusting it on a remote site again.
Where an Integrated ERP Fits Into Your Reporting Strategy
Everything covered so far, templates, photo discipline, governance, KPIs, works best when it isn’t stitched together from three separate tools that don’t talk to each other. That’s the gap an AI-native construction ERP like Designflow-build is built to close: field reporting, project management, and accounting live in one system instead of bouncing between a reporting app, a spreadsheet, and QuickBooks.
Designflow-build’s mobile app captures daily reports, photos, and even voice data entry directly in the field, with offline support built in for jobsites with weak signal. That data doesn’t just sit in a report archive. It flows automatically into job costing, compliance tracking for items like lien waivers and certificates of insurance, and dashboards your PMs can check without waiting for an admin to compile a weekly rollup.
If you’re evaluating platforms against the checklist covered in this article, the ERP evaluation scorecard gives you a structured way to compare options before committing. And if you want to see how the AI-driven project management and reporting features work together in one system, you can start a free trial and have your first pilot project reporting digitally within weeks, not quarters.
Sources
For readers who want to go deeper on specific pieces of this topic, these sources cover the definitions, implementation detail, and visualization concepts referenced throughout this article.
- Enhancing construction site reporting efficiency through digitisation - Designing Buildings
- What is digital reporting? - Financial Reporting Council (FRC)
- PageSpeed Insights - About - Google Developers
- Data Studio (Looker Studio) - Google Cloud
- Real-time digital construction inspection report - TÜV SÜD