
Commercial Project Performance Benchmarking: A Practical Guide

Commercial project performance benchmarking is the systematic practice of comparing your project’s cost, schedule, productivity, quality, and safety results against internal baselines or external industry standards to produce decision-grade intelligence. It turns raw project data into context. Three actions you can take right now:
- Pick 3–5 primary KPIs that matter most to your stakeholders: Cost Performance Index (CPI), Schedule Performance Index (SPI), labor productivity, change order rate, and Total Recordable Incident Rate (TRIR) cover most commercial construction needs.
- Choose your benchmarking type: start with internal benchmarking to build a reliable baseline, then layer in external comparisons once you have at least three comparable projects in your dataset.
- Set a reporting cadence: weekly for field-level signals (labor productivity, RFI turnaround), monthly for cost and schedule metrics, aligned with PMI governance standards and IPA best-practice guidance.
Key Takeaways
Commercial project performance benchmarking is most effective when it combines internal baselines, external validation, and real-time KPI triggers connected to predefined governance responses.
| Point | Details |
|---|---|
| Core definition | Benchmarking compares project cost, schedule, and productivity to standards or peers to produce decision-grade intelligence. |
| Pick your KPIs | Choose 3–5 primary metrics mapped to stakeholder needs; CPI, SPI, labor productivity, and RFI turnaround cover most commercial projects. |
| Govern data and cadence | Weekly field signals, monthly cost reviews, and a named data owner are the minimum governance structure for reliable results. |
| Mix methods across the lifecycle | Use top-down benchmarks at concept stage and bottom-up unit-rate benchmarks once design is mature enough to validate quantities. |
| Use real-time triggers | Set automated CPI/SPI thresholds (e.g., CPI < 0.95 for two periods) linked to predefined mitigation steps to shift from reactive to proactive. |
Start your pilot benchmarking study on a current project by selecting three KPIs, pulling five comparable internal projects, and running a single normalization pass before your next monthly review.
Table of Contents
- What does commercial project performance benchmarking actually mean?
- Which KPIs should your team benchmark on commercial projects?
- What benchmarking approaches work best for commercial delivery?
- How do you run a benchmarking study on a commercial project?
- Where do you get benchmark data, and what errors should you avoid?
- How does benchmarking apply across the project lifecycle?
- A short example: benchmarking a commercial fit-out project
- How project software operationalizes benchmarking for commercial teams
- Why most teams benchmark the wrong things
- Sources
What does commercial project performance benchmarking actually mean?
The formal term used by practitioners and standards bodies is project performance benchmarking, sometimes called project performance measurement in PMO contexts. The core idea is straightforward: you compare your project’s measured results to a reference, draw conclusions about relative performance, and act on the gap.
Benchmarking for projects turns raw data into context and helps identify consistently high-performing projects and early-warning patterns.
The three main benchmarking types for commercial projects
Internal benchmarking compares performance across your own portfolio. It is the natural starting point because the data is accessible, the scope definitions are consistent, and confidentiality is not a concern. A general contractor with 20 completed office fit-outs has a ready-made internal dataset.
External (competitive) benchmarking measures your results against industry peers or published datasets. This tells you where you stand in the market, not just relative to yourself. It requires careful normalization because scope definitions, labor markets, and procurement models vary widely between firms.
Functional or generic benchmarking looks outside the construction industry entirely, borrowing process improvements from sectors with mature performance cultures. A commercial contractor studying lean scheduling practices from automotive manufacturing is doing functional benchmarking. It is most useful when you want a step-change improvement rather than incremental gains.

The practical sequence: start internal to build your baseline, use external benchmarking to evaluate market position, and reach for functional benchmarking when you need to rethink a process from the ground up.
Which KPIs should your team benchmark on commercial projects?
The ten metrics below cover the performance dimensions that matter most across commercial construction delivery. You do not need all ten at once. Pick the subset that matches your stakeholder priorities.
| KPI | Formula / Definition | Why It Matters |
|---|---|---|
| Cost Performance Index (CPI) | Earned Value ÷ Actual Cost | CPI below 0.95 signals cost overrun; CPI above 1.05 is generally healthy |
| Schedule Performance Index (SPI) | Earned Value ÷ Planned Value | SPI < 1.0 means behind schedule; > 1.0 means ahead |
| Schedule Variance (SV) | Earned Value − Planned Value | Dollar-denominated schedule gap; negative = delay |
| Budget Variance (BV) | Budgeted Cost − Actual Cost | Direct measure of cost control at any point in time |
| Labor Productivity | Units installed ÷ Labor hours | Tracks crew efficiency against planned output rates |
| RFI Turnaround Time | Average days from RFI issue to response | Leading indicator: slow RFIs predict schedule slippage |
| Change Order Rate | Change order value ÷ Original contract value | High rates signal scope definition or design maturity issues |
| Rework Rate | Rework cost ÷ Total project cost | Directly erodes margin; benchmarks vary by trade |
| TRIR (Safety) | (Recordable incidents × factor) ÷ Hours worked | Industry-standard safety metric; benchmarks published by OSHA |
| Cost per Unit (or cost/m²) | Total cost ÷ Deliverable units | Normalizes cost for cross-project comparison |
Interpreting CPI and SPI thresholds: a CPI between 0.95 and 1.05 is generally considered healthy on commercial projects. Below 0.90, most governance frameworks require a formal corrective action plan. SPI follows the same logic, though schedule recovery is often harder to achieve than cost recovery late in a project.
Pairing earned-value metrics with leading indicators like RFI turnaround, procurement lead time, and labor productivity gives your team the ability to catch problems before they show up in the monthly cost report.
Commercial project benchmarks show median gross margins typically in the low- to mid-teens, with top-quartile margins somewhat higher. Top performers update WIP weekly and maintain disciplined financial controls. That cadence difference alone separates average performers from the top quartile.
Pro Tip: When choosing your 3–5 primary KPIs, map each one to a specific stakeholder: investors care about margin and CPI, general contractors focus on SPI and change order rate, and superintendents need labor productivity and RFI turnaround. A KPI with no owner gets ignored.
What benchmarking approaches work best for commercial delivery?
Two foundational methods dominate commercial construction benchmarking, and knowing when to use each saves significant effort.
Top-down benchmarking
Top-down benchmarking breaks a project into comparable components (structure, MEP, finishes, external works) and applies a benchmark cost or productivity rate to each component. You then aggregate the component benchmarks to form a “should cost” range for the whole project. The IPA recommends this approach early in a business case, precisely because it works before detailed design exists. The trade-off is accuracy: component benchmarks carry wider uncertainty bands than unit-rate estimates.
Bottom-up benchmarking
Bottom-up benchmarking builds from unit rates: labor hours per installed unit, material cost per linear foot, equipment cost per shift. It is far more precise but requires mature design documentation and a reliable unit-rate library. Use it from detailed design onward, when you can validate assumptions against actual quantities.
Reference-class forecasting
Reference-class forecasting (RCF) is a distinct method developed to counter optimism bias in project planning. Instead of estimating from the inside out (your project’s specific conditions), RCF anchors the forecast to the statistical distribution of outcomes from a reference class of comparable past projects. It is particularly powerful for schedule and cost-at-completion forecasting on complex commercial projects where internal estimates consistently underperform.
The practical guidance: use top-down benchmarking for early affordability checks and whole-life carbon assessments, switch to bottom-up when design is mature enough to support unit-rate validation, and apply reference-class logic whenever you need to pressure-test an optimistic internal forecast.
How do you run a benchmarking study on a commercial project?
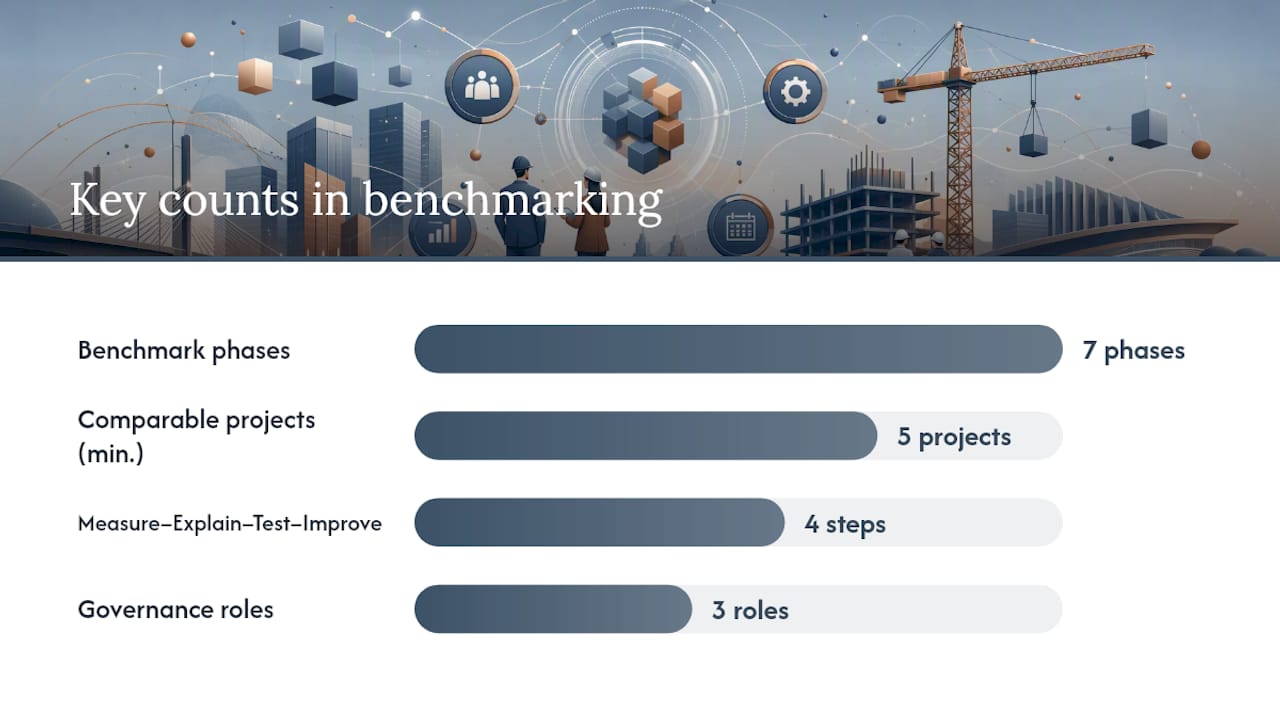
A governance-ready benchmarking process follows seven phases. Each phase has a clear owner and a defined output.
- Define objective and scope. Specify what decision the benchmark will inform (go/no-go, budget approval, performance improvement) and which project phases are in scope.
- Select comparable projects and KPIs. Identify at least five comparable projects for statistical credibility. Choose KPIs that align to the decision objective.
- Collect and clean data. Pull from your ERP, WIP reports, and field logs. Flag and resolve anomalies before analysis. NIST Technical Note 1830 is clear that high-quality benchmarking requires documented measurement context, validated instruments, and repeatable procedures to produce credible, reproducible results.
- Normalize and adjust. Align scope definitions, apply escalation indices, and convert to common units (cost/m², cost per component). Without normalization, you are comparing apples to oranges.
- Analyze and diagnose. Identify gaps between your project and the benchmark. Separate structural causes (market conditions, project type) from operational causes (crew efficiency, procurement timing).
- Implement changes. Translate findings into specific actions: procurement strategy adjustment, crew reallocation, schedule resequencing. Assign owners and deadlines.
- Monitor and re-benchmark. Track whether the intervention worked. Re-run the benchmark at the next reporting cycle.
Governance roles: assign a data owner (responsible for data integrity), a subject-matter expert (interprets results), and a PMO reviewer (validates methodology and escalates findings). Without clear ownership, benchmarking reports become documents nobody acts on.
Pro Tip: Apply the Measure–Explain–Test–Improve iterative loop. Measure results, explain what you observe, test your explanation with a controlled change, then improve both the benchmark and the process. Teams that skip the “test” step commonly produce unreliable conclusions and repeat the same mistakes.
Where do you get benchmark data, and what errors should you avoid?
Practical data sources
- Surety and bonding datasets: surety underwriters track WIP accuracy and margin trends across their book of business; past performance data from bonded projects is a credible external signal.
Normalization checklist before you compare
| Check | What to verify |
|---|---|
| Scope alignment | Same inclusions/exclusions (FF&E, site works, contingency) |
| Unit normalization | Cost per m², cost per component, or cost per installed unit |
| Escalation adjustment | Apply a recognized cost index to bring all projects to a common base date |
| Geographic adjustment | Labor and material markets vary significantly by region |
| Sample size | Fewer than five comparable projects produces unreliable statistics |
Common pitfalls
- Apples-to-oranges comparisons: a Class A office fit-out and a shell-and-core industrial build are not comparable without substantial adjustment, even if both are “commercial.”
- Small-sample overconfidence: a benchmark built on two or three projects is anecdote, not data. Five is a floor; ten or more produces meaningful distributions.
- Biased self-reported data: firms tend to report favorable outcomes. External or third-party datasets reduce this risk.
- Confidentiality limits: benchmark data shared in consortiums often carries restrictions on how it can be used or disclosed. Understand the terms before you build a report around it.
How does benchmarking apply across the project lifecycle?
Benchmarking is not a single event. Its value multiplies when you embed it at each stage of delivery.
- Concept and feasibility: top-down component benchmarks test affordability and whole-life carbon before any design spend. This is where reference-class forecasting prevents optimism bias from locking in an undeliverable budget.
- Design development: as design matures, shift to bottom-up unit-rate benchmarks. Compare your emerging quantities and rates against your internal library and external datasets. Real-time budget tracking at this stage catches scope creep before it becomes a contract problem.
- Procurement: benchmark bid prices against your unit-rate library and market indices. A bid that lands 15% below your benchmark deserves scrutiny, not celebration.
- Construction: weekly field benchmarks on labor productivity and RFI turnaround give your superintendent actionable signals. Monthly cost benchmarks (CPI, budget variance) feed the PMO review.
- Handover and post-project: capture actual unit rates, final CPI/SPI, and margin outcomes into your internal dataset. Every completed project makes your next benchmark more reliable.
The shift from retrospective to real-time benchmarking is where modern project software earns its keep. Integrated dashboards that update as field data arrives let you intervene mid-project rather than document what went wrong after practical completion. Real-time data changes benchmarking from a reporting exercise into a decision tool.
Pro Tip: Set automated triggers tied to your KPI thresholds: if CPI drops below 0.95 for two consecutive reporting periods, a predefined mitigation protocol activates automatically. Predefined responses remove the delay between detection and action.
A short example: benchmarking a commercial fit-out project
A mid-size general contractor was delivering a 40,000 sq ft commercial office fit-out. At the start of detailed design, the project team ran a top-down benchmark using five comparable internal projects, normalizing for floor plate size, specification level, and base-date cost. The benchmark produced a “should cost” range of $82–$91 per sq ft for the fit-out scope.
Three actions followed: the MEP package was re-tendered with a revised procurement timeline, the crew schedule was resequenced to reduce overtime exposure, and a bottom-up unit-rate validation confirmed the revised subcontractor pricing was within benchmark range.
Result: the revised forecast brought the project to $88 per sq ft, within the benchmark range, and the final CPI at project completion was 0.97, compared to a pre-intervention trajectory of 0.88.
That 9-point CPI improvement on a project of this size translated directly to margin recovery. The benchmark did not make the decision; it made the problem visible early enough to act.
How project software operationalizes benchmarking for commercial teams
Running continuous benchmarking manually, through spreadsheets and disconnected reports, is where most firms lose the value. The platform capabilities you need to make benchmarking a weekly operational habit rather than a quarterly exercise include:
- Integrated cost and schedule data: CPI and SPI calculations require earned value, actual cost, and planned value in a single system. Pulling these from separate tools introduces reconciliation errors.
- WIP accuracy and job costing by cost code: granular cost-code tracking lets you benchmark at the component level, not just the project total.
- Automated KPI computation: CPI, SPI, budget variance, and labor productivity should calculate automatically as field data arrives, not after a manual data entry cycle.
- Unit-rate libraries: a maintained library of historical unit rates is the foundation of bottom-up benchmarking. It needs to live in the system, not in someone’s spreadsheet.
- Dashboards and alerting: traffic-light thresholds and automated alerts (CPI < 0.95, RFI turnaround > 5 days) replace the manual review cycle with proactive notification.
Designflow-build’s AI-native construction ERP combines project management, accounting, WIP reporting, and field operations in one system, which means the data your benchmarking process depends on is already integrated and current. The platform’s AI-driven risk prediction flags performance deviations before they compound, and its construction scheduling software supports SPI computation and schedule benchmarking natively.
Designflow-build reports a 70% reduction in manual data entry for its users, which directly reduces the data-quality errors that invalidate benchmarking comparisons.

For teams replacing manual processes, moving off Excel into an integrated ERP is the single highest-leverage step toward reliable, continuous benchmarking.
Why most teams benchmark the wrong things
Benchmarking works best when it is treated as decision-support, not performance theater. The temptation is to measure everything and report it all. The result is a dashboard nobody reads and a process that consumes analyst time without changing a single field decision.
Three reminders worth keeping close:
First, start internal. Your own historical data is more comparable, more accessible, and more actionable than any external dataset you can buy. Build your internal baseline before you spend money on industry benchmarks.
Second, protect data quality above all else. A benchmark built on inaccurate WIP data or inconsistent scope definitions is worse than no benchmark, because it produces false confidence. Governance, cadence, and a named data owner are not optional extras.
Third, tie every benchmark to a governance decision. If a KPI threshold breach does not trigger a defined response, the metric is decorative. Benchmarking earns its place in the project rhythm when it is connected to the decisions that actually move outcomes.
One honest limitation: benchmarks inform judgment; they do not replace it. A CPI of 0.93 on a project navigating an unprecedented supply chain disruption tells a different story than the same number on a straightforward fit-out. Context is always part of the analysis.
Sources
- Best Practice in Benchmarking (Infrastructure and Projects Authority)
- Software performance metrology guidance (NIST Technical Note 1830)
- Benchmarking for projects: metrics, types, and steps (Teamwork blog)
- Commercial Project Benchmarks: WIP & Bonding (LevelCFO)
- Construction KPIs for project health (iRecruit insights)