
10–200 Activity Models Make Schedule Risk Analysis Work for PMs

Schedule risk analysis combines a validated CPM schedule with Monte Carlo simulation to turn “we might finish late” into a specific probability, a defensible contingency figure, and a ranked list of what’s actually driving delay risk. It follows the modeling approach outlined in AACE RP 64R-11 and PNNL’s schedule risk guidance. Run it at baseline approval, at major gate reviews, and after any significant scope or logic change, since a stale SRA is close to worthless.
TL;DR:
- Most schedule risk analysis models should include no more than 200 activities focused on critical and near-critical paths to remain manageable and credible.
- Reliable inputs require up-to-date schedule logic, accurate three-point duration estimates from experts, and properly modeled discrete risk events rather than automatic percentage ranges.
- Re-running schedule risk analysis after major project changes and regularly during execution ensures the contingency reflects current risks and project conditions.
- Owners typically select a contingency percentile of P80 to balance cost and confidence, while risk-averse agencies may prefer P90, and more tolerant owners may accept P50.
- Tools that integrate live project data and support Monte Carlo simulation, like Designflow-build, greatly improve input accuracy and reduce manual reconciliation, leading to more trustworthy risk assessments.
Table of Contents
- What Schedule Risk Analysis Is and Why Project Controls Teams Need It
- Core Concepts: CPM, Monte Carlo, and the Estimates That Make Them Work
- The Step-by-Step Schedule Risk Analysis Process
- Inputs and a Model-Quality Checklist Before You Trust the Output
- Common Pitfalls That Quietly Invalidate an SRA
- Reading the Output: P-Values, Contingency, and Driver Analysis
- Where Tools, AI, and BIM Actually Help (and Where They Don’t)
- How Integrated Project Data Strengthens Schedule Risk Inputs
- What Actually Separates a Useful SRA From a Wasted One
- Put Schedule Risk Analysis Into Practice With Designflow-build
- Sources
- FAQ
What Schedule Risk Analysis Is and Why Project Controls Teams Need It
Schedule risk analysis is a probabilistic evaluation of how uncertainty and discrete risk events affect a project’s finish date. Instead of one deterministic date sitting at the end of a CPM network, SRA produces a range of possible outcomes, each with an associated likelihood.
That range answers questions a single-point schedule never can. A well-built SRA tells your team:
- How likely is on-time or on-budget finish under the current plan?
- How much schedule contingency should sit above the baseline, and where?
- Which activities or risk events are actually driving the spread in outcomes?
- Where should mitigation dollars and management attention go first?
- How should contingency get drawn down as work progresses and risks retire?
SRA delivers the most value at specific lifecycle moments rather than as a one-off exercise. Baseline acceptance is the obvious one, since that’s when contingency gets locked into the budget. Gate reviews are another, because stakeholders want to know if the plan is still credible. And any time a project absorbs a major change order, a permitting delay, or a supply chain shock, the model needs a fresh run. Skipping that update is how a project ends up defending a contingency number that no longer reflects reality.
Core Concepts: CPM, Monte Carlo, and the Estimates That Make Them Work
A schedule risk analysis is only as good as the CPM schedule underneath it. That model needs clean logic: no dangling activities, no open-ended constraints holding dates artificially in place, and a critical path that reflects how the work will actually sequence. If the base schedule is unreliable, the simulation just runs uncertainty through a broken structure and produces a confident-looking wrong answer.
Monte Carlo simulation runs the CPM network thousands of times, each time drawing random durations from the ranges you’ve defined for each activity, then records where the project finishes each time. Run enough iterations and a distribution emerges. The results get reported as percentiles: a P50 date means half the simulated outcomes finished by then, a P80 means 80% did. That’s the language contingency conversations run on.
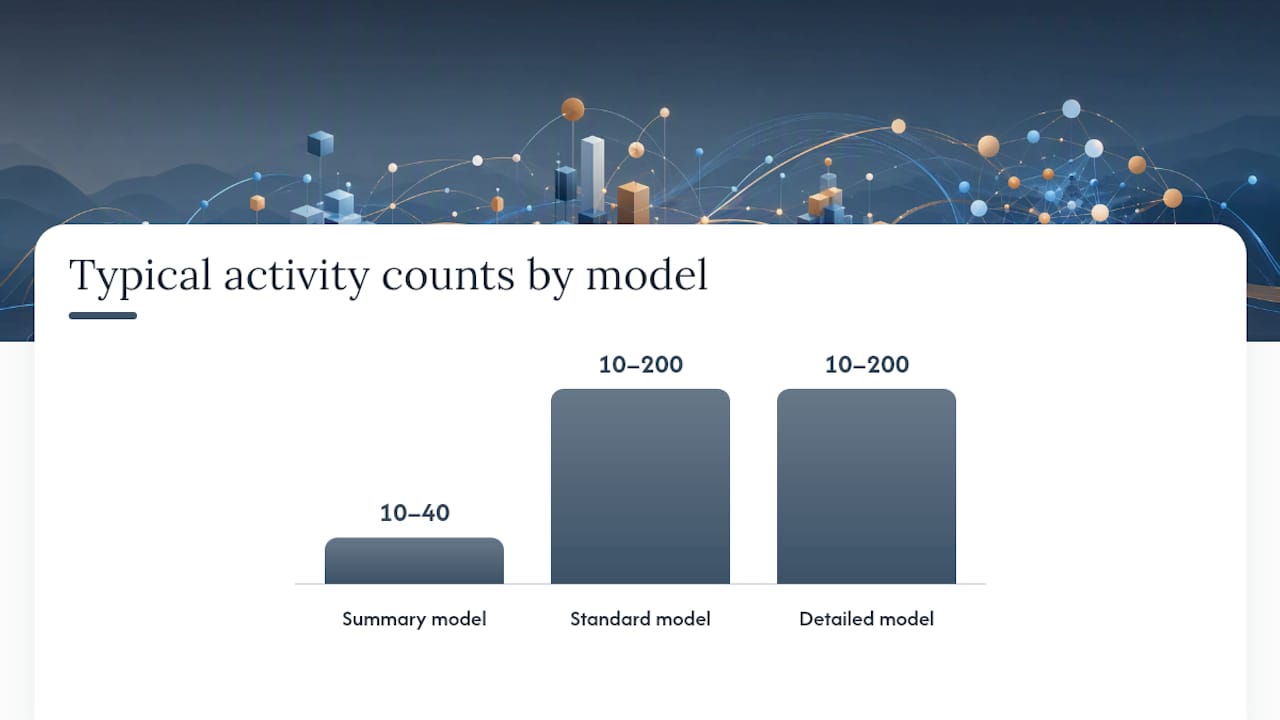
Statistic: Practitioner guidance from PMWorld Library recommends keeping SRA models to roughly 10 to 200 activities, focused on the critical and near-critical paths, so estimates stay meaningful and the model stays auditable.
A few concepts separate a credible SRA from a guess dressed up in software:
- Three-point estimates (optimistic, most likely, pessimistic) elicited from people who actually do the work, not arbitrary percentage swings.
- Discrete risk events (a permit denial, a subcontractor default) are separate from inherent duration uncertainty (normal variability in how long framing takes) and should be modeled differently.
- Correlation between related activities, probabilistic calendars for weather-exposed work, and resource variance all add realism when the data supports them.
The Step-by-Step Schedule Risk Analysis Process
Running a defensible SRA follows a consistent sequence. Rushing past the first step is the single most common reason results get thrown out at review.
- Prepare the model. Run a schedule health check: remove artificial constraints, verify logic ties correctly to predecessors and successors, and confirm the critical and near-critical paths make sense. Decide whether you need a detailed model or a summary-level one built around major milestones.
- Identify and quantify risks. Build or update the risk register, then elicit three-point duration estimates and event probabilities from the people closest to the work. Capture dependencies between risks where they genuinely exist.
- Build the simulation model. Map each risk to the specific activities it affects, assign probability distributions, and add correlations or calendars only where you can justify them with real project logic.
- Run the simulation. Execute enough Monte Carlo iterations to stabilize the output, then generate sensitivity analysis and risk contribution rankings to see which inputs are actually moving the finish date.
- Interpret and act. Select a contingency percentile appropriate to the project’s risk tolerance, present mitigated versus unmitigated finish-date profiles side by side, and recommend specific mitigation actions along with a schedule for re-running the analysis.
Pro Tip: Run the simulation once with your full risk register applied and once with only the top three drivers neutralized. The gap between those two curves is the clearest way to show a steering committee what mitigation is actually worth.
Inputs and a Model-Quality Checklist Before You Trust the Output
Every credible SRA rests on the same five inputs: a validated CPM schedule, a current risk register, realistic three-point duration ranges, probability estimates for discrete events, and calendar or resource assumptions that match how the work will really happen. Weak input in any one of those categories shows up as a distorted output, usually a contingency number that’s either dangerously thin or so padded nobody trusts it.
Before you accept any SRA result, run it against a short quality checklist drawn from AACE and PMWorld practice:
- No artificial constraints locking dates that should float
- Logic ties align with the accepted baseline, not an outdated version
- Activity count sits in a manageable range, generally 10 to 200 for most simulations
- Three-point estimates came from subject matter experts, not a spreadsheet formula
- Risk events are mapped to specific activities, not vaguely attached to “the schedule”
- Correlations are justified by real project logic, not added by default
- Calendars reflect actual weather, permitting, or crew availability patterns
- Near-critical paths were reviewed, since they often become critical under simulation
- Results were sanity-checked against team intuition before being presented
- The model gets refreshed after any material scope or logic change
| Model scope | Typical activity count | Best use case |
|---|---|---|
| Summary model | 10 to 40 | Executive gate reviews, early feasibility |
| Standard model | 10 to 200 | Baseline contingency setting, most capital projects |
| Detailed model | 10 to 200 | Complex programs with multiple interdependent contractors |
Common Pitfalls That Quietly Invalidate an SRA
The most frequent mistake is dragging an entire 3,000-line master schedule into the simulation because it’s already there. A model that size buries the handful of activities that actually drive risk under thousands that don’t, and the sensitivity results become noise. Build a purpose-fit model focused on the critical and near-critical paths instead.
The second mistake is letting software auto-generate duration ranges with a blanket rule like “apply plus or minus 20% to everything.” That produces distributions that look precise and mean nothing. AACE RP 64R-11 is explicit that elicited three-point estimates from people who understand the work produce far more reliable inputs than any automatic formula.
The third is conflating two different kinds of uncertainty. Normal variability in how long an activity takes is not the same thing as a discrete event like a permit denial or a strike, and modeling them the same way distorts the resulting probability curve.
- Peer review every risk register entry before it goes into the model
- Sanity-check the P50 output against the team’s gut sense of the project
- Re-run sensitivity analysis after any major mitigation is added
Pro Tip: If your P80 contingency looks suspiciously close to your P50, check whether someone applied a flat percentage across the board instead of eliciting real ranges. That flatness is usually the tell.
Reading the Output: P-Values, Contingency, and Driver Analysis
The simulation’s percentile curve is the deliverable that actually gets used. A P50 finish date means the project has a 50% chance of finishing by that date under the modeled uncertainty; a P80 or P90 gives more confidence but demands more contingency. Most owners set contingency at P80, which the DEchema guidance on schedule risk analysis describes as a common balance between cost of reserve and confidence of delivery. Higher-risk-tolerance owners sometimes hold at P50 and accept more exposure; risk-averse public agencies often push to P90.
Sensitivity or driver analysis is where the real decision value sits. It ranks activities and risk events by how much each one contributes to the spread in outcomes, which tells the team exactly where to spend mitigation effort instead of spreading attention evenly across the whole plan. Some advanced models now map risk interaction networks alongside the project network itself, capturing how a delay in one activity cascades into risk exposure for downstream work that a simple critical-path view would miss.
Statistic: PNNL’s guidance frames SRA outputs as answering four specific questions: likelihood of on-time finish, the realistic range of finish dates, the top risk drivers, and how contingency should be drawn down as the project executes.
- Present mitigated and unmitigated curves side by side so stakeholders see what action buys
- Recommend a re-run cadence tied to gate reviews, not a fixed calendar interval
- Track contingency drawdown against actual risk retirement, not just elapsed time
Where Tools, AI, and BIM Actually Help (and Where They Don’t)
Three categories of tools support an SRA workflow: CPM-native risk engines that run the Monte Carlo simulation itself, integrated scheduling platforms that hold the underlying logic, and data warehouses that store historical duration and risk data across past projects. Each solves a different part of the problem, and none of them replaces expert judgment on the inputs.
BIM and 4D scheduling data add real value when they supply better duration ranges grounded in actual quantities and sequencing logic, rather than an estimator’s memory of the last similar job. Historical project databases do something similar at scale, giving you a baseline distribution to check a new estimate against.
AI and machine learning are increasingly used to flag likely risk patterns and automate parts of risk register maintenance. Recent academic reviews point to real gains here, but they consistently caution that AI works best augmenting expert elicitation, not replacing it, and that model outputs need to stay interpretable enough for a project controls team to trace how an input became a prediction.
- Keep one single source of truth for schedule, cost, and risk data
- Document every assumption behind a duration range or probability estimate
- Refresh underlying data on a set cadence, not only when someone remembers to
How Integrated Project Data Strengthens Schedule Risk Inputs
The biggest practical obstacle to good SRA isn’t the simulation math, it’s getting clean, current inputs into the model. When schedule data, cost data, and field progress all live in separate tools, someone has to reconcile them by hand before a risk register update means anything. Designflow-build’s AI-driven project management links a live risk register to the same platform running project scheduling, field data, and job costing, so the inputs feeding an SRA reflect what’s actually happening on site rather than a snapshot from last month’s status meeting.
Contractors using the platform have reported a 70% reduction in manual data entry, which matters directly here: fewer manual reconciliation steps mean fewer stale risk inputs. Implementation often runs in a matter of weeks, which can be fast enough to get a project’s data foundation in place before a baseline review needs a fresh SRA.
What Actually Separates a Useful SRA From a Wasted One
Most teams over-invest in model complexity and under-invest in getting three or four risk inputs genuinely right. A detailed 150-activity model built on rough elicited estimates beats a 40-activity summary model built on guessed percentages every time, and a summary model is often the correct choice for a gate review anyway.
Match the depth to the decision. A quarterly executive update needs a summary model; a baseline contingency negotiation needs the full workup with sensitivity rankings. Running SRA quarterly, or after any material change, keeps it embedded as routine project controls practice rather than a one-time compliance exercise nobody trusts by month six.
— Keith
Put Schedule Risk Analysis Into Practice With Designflow-build
A credible SRA depends on inputs that stay current, and that’s the part most teams struggle with long after they’ve learned the Monte Carlo math. Designflow-build combines scheduling, accounting, and field data in one system, so the risk register, cost codes, and CPM logic your SRA depends on come from the same live source instead of three disconnected spreadsheets.
The platform’s construction scheduling software supports CPM and Monte Carlo workflows directly, while AI-driven risk prediction flags emerging schedule threats before they show up as a missed milestone. With reported implementation timelines of 2 to 4 weeks and a 98% user adoption rate, project controls teams can get a cleaner data foundation in place well before their next baseline review. If you’re ready to see how integrated data improves the inputs behind your next schedule risk analysis, explore the construction scheduling software page or check the construction software glossary for terms you’ll encounter along the way.
Sources
- Schedule Risk Analysis | PNNL
- 64R-11: CPM Schedule Risk Modeling and Analysis: Special Considerations
- Schedule Risk Analysis: A brief guide (PMWorld Library)
FAQ
What are the four stages of risk analysis?
Most frameworks, including the approach behind SRA, follow four stages: identify risks, quantify their probability and impact, model them against the schedule or budget, and respond with mitigation and monitoring.
What is a schedule analysis?
A schedule analysis reviews a project’s CPM logic, durations, and float to check whether the plan is realistic and internally consistent; schedule risk analysis goes further by adding probability distributions to quantify how uncertain that plan really is.
How often should a project team re-run schedule risk analysis?
Re-run it at baseline acceptance, at major gate reviews, and after any significant scope, logic, or risk register change, rather than on a fixed calendar schedule.
Does AI replace expert judgment in schedule risk analysis?
No. Research on AI-augmented risk prediction consistently finds it works best supporting expert elicitation with pattern recognition and faster risk detection, not replacing the human judgment behind duration and probability estimates.